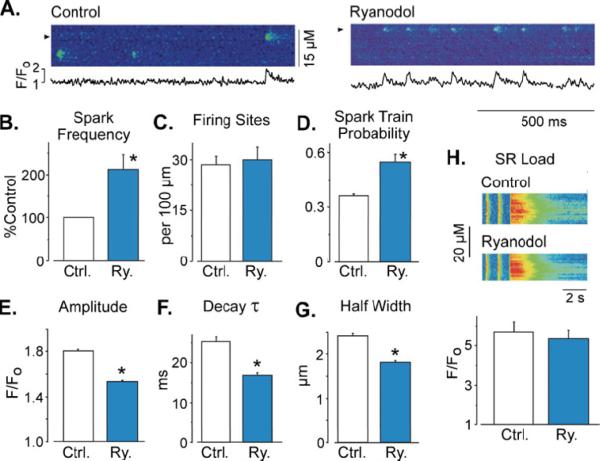
Fig. 5.
Ryanodol action on Ca2+ sparks in iniact myoeytes. An asterisk indicates p<0.001. a Line scan images showing Ca2+ sparks in before (left and center) and following 50 μM ryanodol application (right). Shown below are fluorescence profile traces (F/F0) at the positions marked by the arrows. b Ca2+ spark frequency (Ca2+ sparks per second per 100 μm line; n=4) determined in control cells before (white bar) and after 2-min lyanodol exposure (blue bar). c Number of sites that generate at least one Ca2+ spark during a 15-s recording period. d Probability that a site generates repeated Ca2+ sparks (i.e., a spark train). e Average of Ca2+ sparks amplitude in control (white bar, n=297 Ca2+ sparks in 14 cells) and after ryanodol exposure (blue bar, n=412 Ca2+ sparks. 9 cells). f Time constant of Ca2+ sparks decay (obtained by single exponential fitting of individual spark F/F0 decay). g Full width at half-maximal Ca2+ spark amplitude. h SR Ca2+ load obtained by rapid caffeine perfusion before (white bar) and after ryanodol exposure (blue bar). Ryanodol did not significantly alter global SR Ca2+ load

