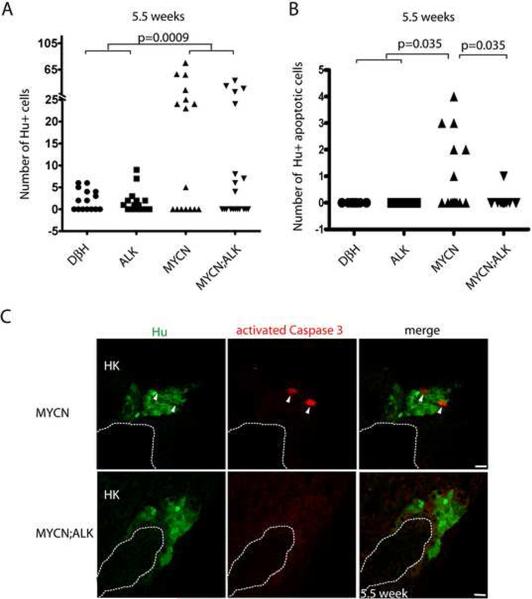
Figure 8. ALK inhibits a developmentally-timed apoptotic response triggered by MYCN overexpression in the interrenal gland.
(A) Numbers of Hu+ interrenal gland cells in the DβH, ALK, MYCN and MYCN;ALK fish at 5.5 wpf. Means of Hu+ cell numbers were compared by the two-tailed Wilcoxon signed-rank test.
(B) Numbers of apoptotic Hu+ interrenal gland cells in the DβH, ALK, MYCN and MYCN;ALK fish at 5.5 wpf. The numbers of transgenic fish at 5.5 wpf with apoptotic Hu+ cells in the interrenal gland were compared by two-tailed Fisher exact test.
(C) Sagittal sections through the interrenal gland in MYCN (top panels) and MYCN;ALK (bottom panels) transgenic fish at 5.5 wpf (dorsal up, anterior left). Hu, green; activated Caspase-3, red. Hu+, activated Caspase-3+ apoptotic cells were detected in the MYCN transgenic fish (arrowheads). Dotted lines indicate the head kidney (HK) boundary. Scale bars, 10 μm.
See also Figure S7.

