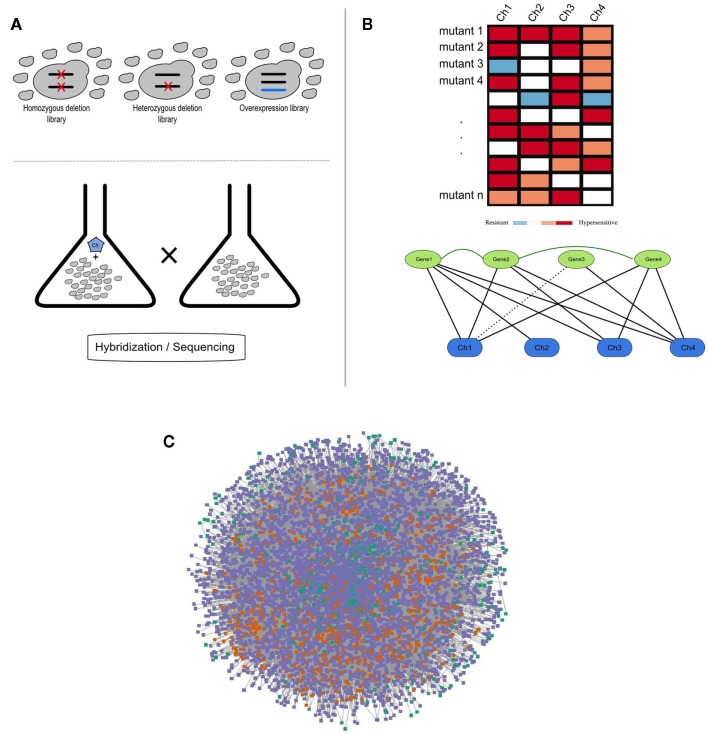
Figure 1.
(A) Schematic representation of a chemogenomics screen. Homozygous, heterozygous, and overexpression mutant libraries are grown in the presence and absence of a chemical. The growth of each mutant is then measured using hybridization or sequencing methods; (B) Chemogenomics data can be represented as a heatmap or modeled as a network (black solid and dashed edges for susceptibility and resistance, respectively) and genes with similar chemical genetic profiles are subsequently linked (dark-green edges). This rationale was used to construct the SCPnet. Only interactions reflecting increased susceptibility were used; (C) Network representation of 34 integrated chemogenomic datasets (i.e., CPnet; Venancio et al., 2010b). Color codes: SCP-hubs (orange), chemicals (green), and other genes (purple). See the text for details on the SCP-hubs definition.

