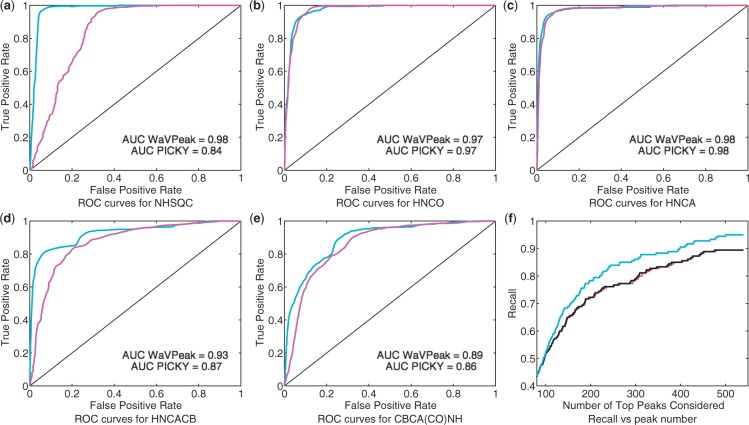
Fig. 4.
(a)–(e) ROC curves of WaVPeak and PICKY for NHSQC, HNCO, HNCA, HNCACB and CBCA(CO)NH, respectively. The curves for WaVPeak are cyan and the curves for PICKY are magenta. The areas under the curve (AUC) for both methods are given in the figures as well. (f) The relationship between the number of top peaks considered and the recall value for the CBCA(CO)NH spectrum of ATC1776. The magenta, black and cyan curves are for PICKY (with the default intensity-based filtering), Daubechies 3 wavelet plus intensity-based filtering and Daubechies 3 wavelet plus volume-based filtering, respectively.

