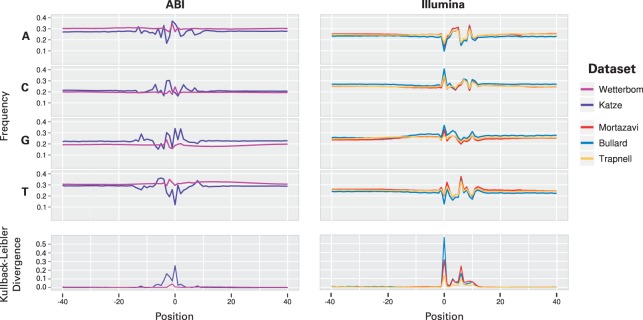
Fig. 1.
Nucleotide frequencies are plotted relative to the start (labeled position 0) of each mapped read, respecting strand, and grouped by platform (Illumina or ABI SOLiD). The datasets plotted here are those used for evaluation, listed in Table 1. The sequence is taken from the genomic context surrounding the read, so that −40 to −1, for example, fall outside the read sequence itself. The symmetrized Kullback–Leibler divergence is used to summarize the difference in nucleotide frequency compared with a fixed estimate of background nucleotide frequencies made by sampling many positions near mapped reads. Under the assumption that reads are sampled uniformly from transcripts, each of the plots should be essentially flat.

