
Fig. 5.
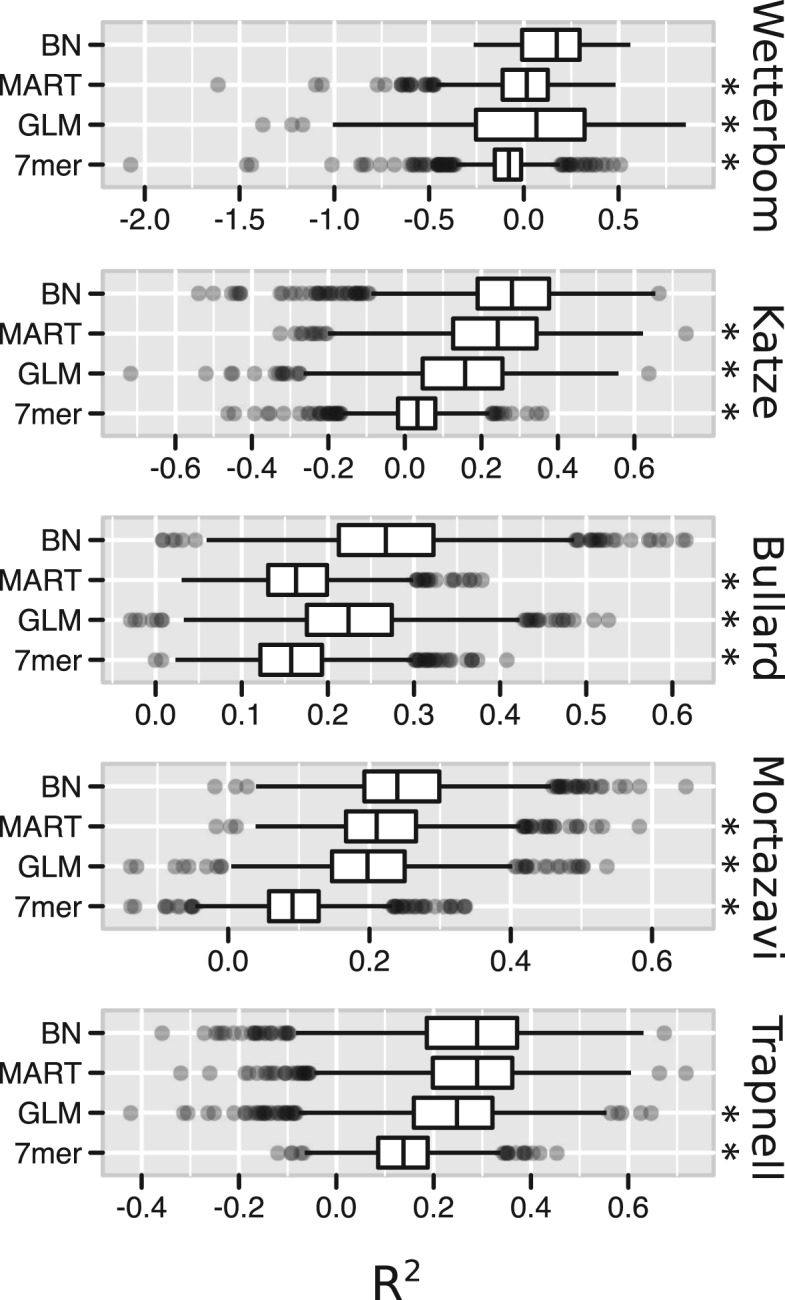
For each of the 1000 test exons, we compute McFadden's pseudo-coefficient of determination R2, equivalent to the improvement in log-likelihood under the bias-corrected model. The statistic is positive, and increases as uniformity is increased, and negative when uniformity is decreased. Marked with asterisks are methods over which the BN approach showed a statistically significant improvement when applied to the same data, according to a one-sided Wilcoxon signed-rank test. In each of those marked, we observed P < 10−23. Boxes are plotted to mark the 25, 50 and 75% quantiles, with whiskers extending to 1.5 times the interquartile range (i.e. the span between the 25% and 75% quantiles), and dots marking more extreme values.