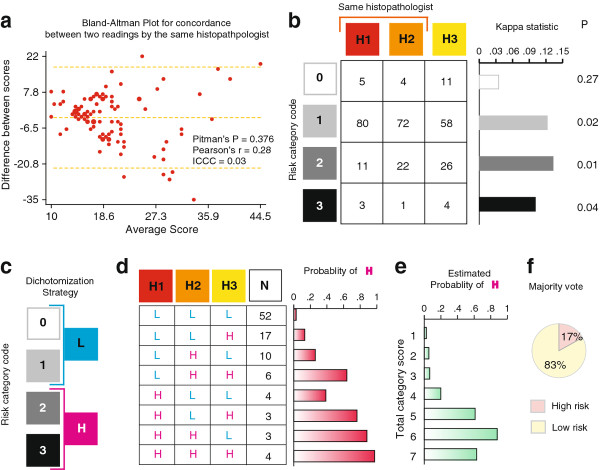
Figure 2.
Variability in the evaluation of precancerous lesions on histopathology. (A) Intra-rater agreement on the Smith and Pindborg's scores at two time points spaced 3 months apart. The chart shows difference versus average Bland-Altman plot and the dotted lines represent the mean and 95% confidence interval for the difference. Pitman's P, significance value for difference in variability in two observations obtained using Pitman's variance ratio test. (B) Three histopathological evaluations (H1-H3) were available for each specimen. Two evaluations (H1 and H2) were contributed by the same pathologist at two different time points, while the third evaluation (H3) was contributed independently by a second histopathologist. Each lesion was classified as no (code 0), mild (code 1), moderate (code 2) or severe (code 3) dysplasia. These codes correspond to the Figure 1, panels E through H, respectively. Table shows the number of subjects classified based on each evaluation. Bar chart to the right shows the within-outcome category agreement using the kappa statistic. P, significance value of the kappa statistic. (C) Strategy used for dichotomization of the histopathology results. The colors match those in panel D. (D) Combinatorial representation of the three histopathological evaluations for latent class analyses. N, number of subjects. Bar chart to the right shows the estimated probability of a high-risk lesion (H) for given combination of the three histopathological evaluations. (E) Bar chart showing the association between total histopathological score and the estimated probability of a true high-risk lesion. No study subject had a score of 0, 8 or 9. (F) Pie chart showing the proportion of subjects classified as high risk (pink sector) or low risk (yellow sector) based on majority vote from the three histopathological evaluations.

