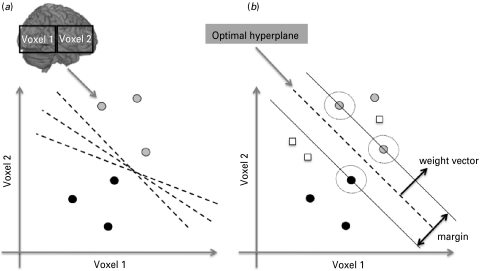
Fig. 1.
The support vector machine (SVM) classifier. (a) Illustration of a classification problem between two groups (patients versus controls) for the simplified case of only two voxels. Each brain image (e.g. gray-matter map) corresponds to a point in the input space and each voxel in the image represents one dimension of this space. The gray circles represent the images of patients and the black circles images of healthy controls. The dashed lines represent hyperplanes or decision boundaries that separate the groups. (b) Illustration of the optimal hyperplane determined by the SVM algorithm. The optimal hyperplane (dashed line) is the one with the largest margin of separation between the two classes or groups. The symbols at the margin (circled) are the support vectors. During the training phase the SVM finds the optimal hyperplane or decision boundary. During the test phase the decision boundary can be applied to classify new examples (white squares). The optimal hyperplane is described by a weight vector and an off-set.

