
Table 1.
Sociodemographic and clinical characteristics of the patients included in the analyses
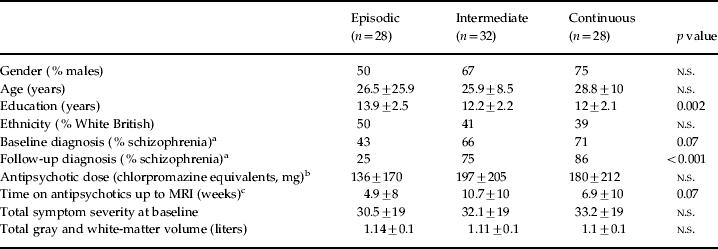
MRI, Magnetic resonance imaging; n.s., not significant.
Values given as percentage or mean ± standard deviation.
a
Change in diagnosis over follow-up does not simply reflect an increase in one diagnostic group and a decrease in another one, but a change in both directions, with approximately 45% of patients changing diagnosis at follow-up.
b
Information missing for nine subjects.
c
Information missing for 10 subjects.