
Table 2.
Results of the support vector machine (SVM) classification
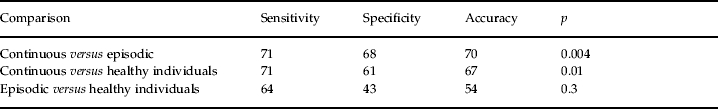
The results are give for the SVM classification in two classes: ratio of true positive (sensitivity), true negative (specificity), accuracy and statistical probability. The first column shows the groups of subjects considered in each classification. The second column shows the percentage of subjects in the first group correctly classified as pertaining to it (sensitivity). The third column shows the percentage of subjects in the second group correctly classified as non-pertaining to the first group (specificity). The fourth column shows the accuracy (arithmetic mean between sensitivity and specificity). The last column shows the statistical probability that the result has been obtained by chance. It was obtained after 1000 permutations within the subjects. The number of subjects considered in each classification was 56 (28 in each group).