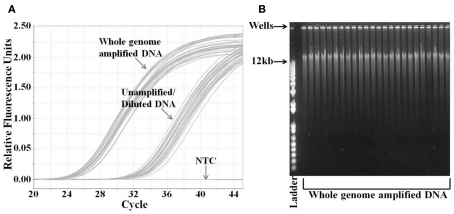
Figure 1.
Analysis of whole genome amplified DNA samples. (A) Quantification of DNA concentration by real-time PCR analysis of RNase P gene. DNA from whole genome amplified and unamplified samples were analyzed by RNase P Taqman™ assay. DNA from unamplified samples was diluted equivalently to that amount of dilution by the whole genome amplification. (B) Agarose gel electrophoresis analysis of the whole genome amplified DNA samples. Samples were run on 0.8% agarose gel with the DNA ladder. The highest molecular weight in the ladder is 12 kb. The PCR graph and the gel image are representative of the 285 samples from Trial 1. NTC, no template control.

