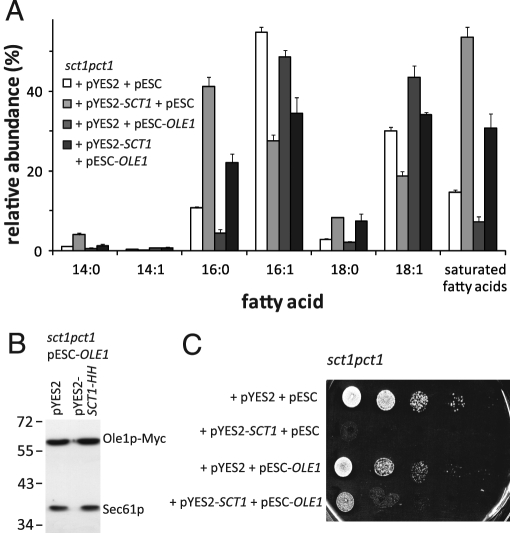
FIGURE 4:
Co-overexpression of Ole1p and Sct1p reveals competition for the shared substrate C16:0-CoA. (A) sct1pct1 cells transformed with the indicated plasmids were cultured to mid-log phase in SGR and analyzed for their fatty acid contents by gas chromatography. The relative abundance (mol%) of the six major fatty acids and of total saturated fatty acids is shown, with the error bars representing the variation (n = 2). (B) Western blot analysis of the Ole1p expression levels of sct1pct1 pYES2 + pESC-OLE1 and sct1pct1 pYES2-SCT1-HH + pESC-OLE1. (c) Serial dilutions of sct1pct1 cells transformed with the plasmids indicated and precultured in synthetic glucose medium were spotted on SGR plates and incubated at 30°C for 3 d.

