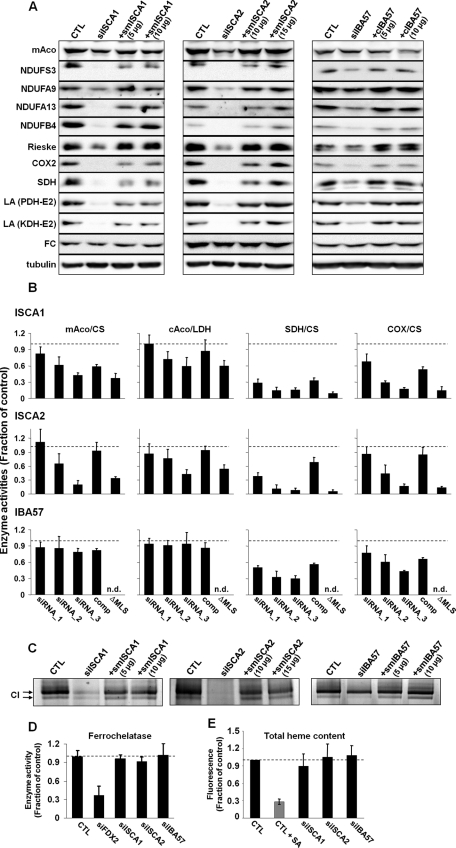
FIGURE 5:
Depletion of ISCA1, ISCA2, or IBA57 affects maturation of mitochondrial [4Fe-4S] proteins and cytosolic aconitase. HeLa cells were treated as described in Figure 3 with siRNAs and the indicated amounts of complementing plasmids. (A) Cell lysates of the third transfection (grown for 9 d) were examined by immunostaining with the indicated antibodies. Staining against tubulin served as a loading control. COX-2, cytochrome oxidase 2; CTL, mock-treated cells; FC, ferrochelatase; KDH, α-ketoglutarate dehydrogenase; LA, lipoic acid; mAco, mitochondrial aconitase; NDUFA9, subunit A9 of complex I; NDUFA13, subunit A13 of complex I; NDUFB4, subunit B4 of complex I; NDUFS3, subunit S3 of complex I; PDH, pyruvate dehydrogenase; Rieske, Fe/S protein of complex III; SDH, succinate dehydrogenase. (B) Harvested cells were fractionated by digitonin treatment and centrifugation (Figure 1A). Fractions were analyzed for the indicated enzyme activities by spectrophotometry. Citrate synthase (CS) and lactate dehydrogenase (LDH) activities were used to normalize mitochondrial and cytosolic enzyme quantifications, respectively. For each transfection set, values of treated cells were normalized to those of mock-treated control cells. The average (SD) of three sets of normalized values is presented. Suffix 1 to 3, number of transfections; comp, complementation construct after third transfection; ΔMLS, respective complementation construct lacking the mitochondrial localization sequence, after third transfection; n.d., not determined. (C) Cell pellets from B (third transfection) were mechanically lysed and subjected to blue native-PAGE. Complex I activity was determined using an in-gel activity assay. (D) After the third transfection, ferrochelatase enzyme activity was estimated by following the incorporation of 55Fe into deuteroporphyrin IX. The resultant 55Fe-heme formation was normalized to that of mock-treated control cells (CTL), and three data sets were averaged. The analysis includes cells RNAi depleted for human ferredoxin 2 (siFDX2; Sheftel et al., 2010b). (E) To measure the total heme content after three rounds of transfection, cell pellets were dissolved in 2 M oxalic acid and boiled for 30 min, which releases iron from heme, thus generating fluorescent protoporphyrin IX (Morrison, 1965; Ward et al., 1984). As a control, HeLa cells were treated with 0.1 mM of the heme biosynthesis inhibitor succinyl acetone (SA) and harvested after 3 d. Fluorescence emission was determined and normalized to that of control cells. Three independent data sets were averaged. Error bars represent SDs.

