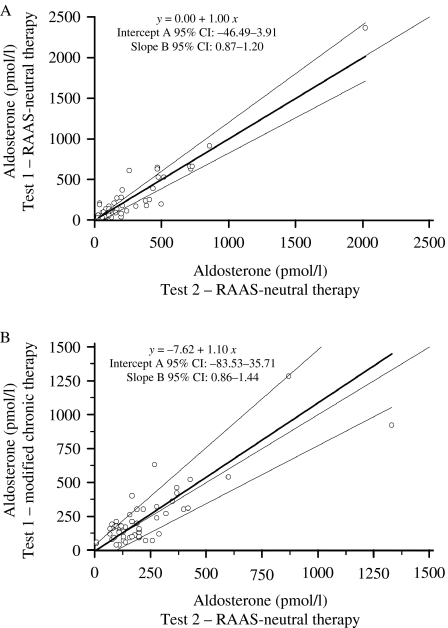
Figure 2.
Comparison of serum aldosterone at the end of the confirmatory tests. This graph compares the end-test serum aldosterone (open circle) in Groups A (A) and B (B). Passing–Bablok regression analysis was used to analyze the differences between the compared confirmatory tests. In both study groups, wide 95% confidence intervals (CI) describing the regression line indicate only moderate agreement in the main results of the compared confirmatory tests. Bold lines indicate regression lines; grey lines indicate 95% CI; and dotted lines indicate identity lines.

