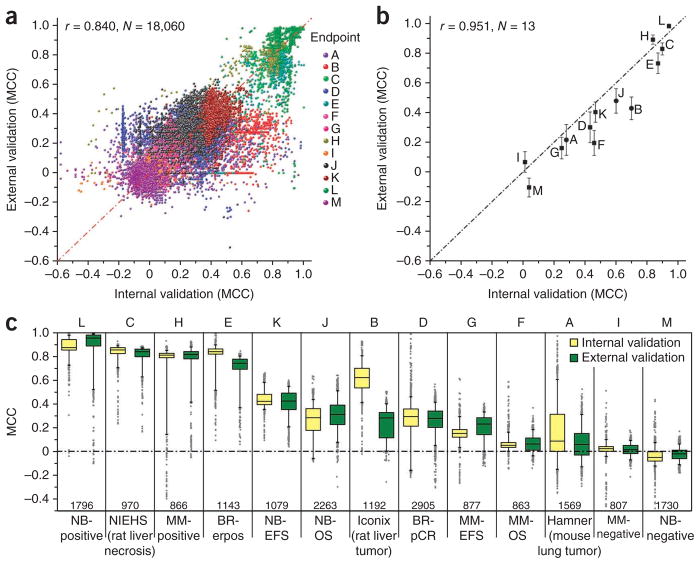
Figure 2.
Model performance on internal validation compared with external validation. (a) Performance of 18,060 models that were validated with blinded validation data. (b) Performance of 13 candidate models. r, Pearson correlation coefficient; N, number of models. Candidate models with binary and continuous prediction values are marked as circles and squares, respectively, and the standard error estimate was obtained using 500-times resampling with bagging of the prediction results from each model. (c) Distribution of MCC values of all models for each endpoint in internal (left, yellow) and external (right, green) validation performance. Endpoints H and L (sex of the patients) are included as positive controls and endpoints I and M (randomly assigned sample class labels) as negative controls. Boxes indicate the 25% and 75% percentiles, and whiskers indicate the 5% and 95% percentiles.

