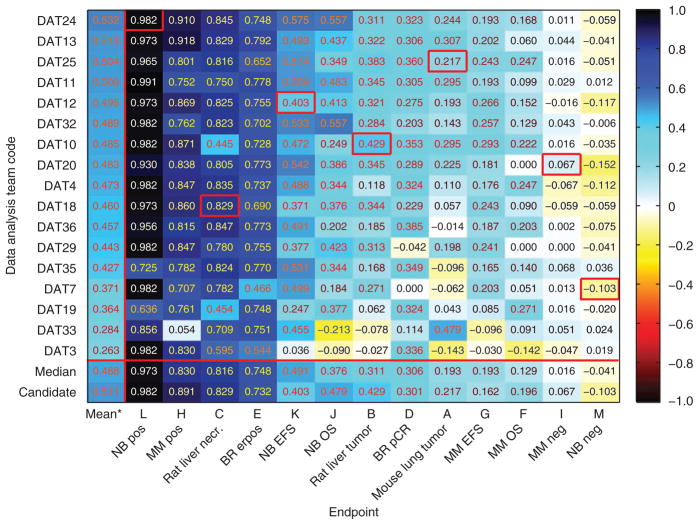
Figure 3.
Performance, measured using MCC, of the best models nominated by the 17 data analysis teams (DATs) that analyzed all 13 endpoints in the original training-validation experiment. The median MCC value for an endpoint, representative of the level of predicability of the endpoint, was calculated based on values from the 17 data analysis teams. The mean MCC value for a data analysis team, representative of the team’s proficiency in developing predictive models, was calculated based on values from the 11 non-random endpoints (excluding negative controls I and M). Red boxes highlight candidate models. Lack of a red box in an endpoint indicates that the candidate model was developed by a data analysis team that did not analyze all 13 endpoints.

