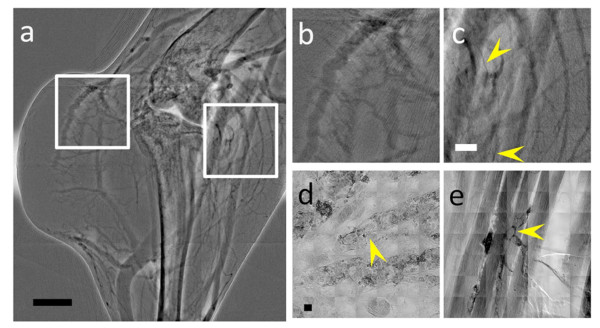
Figure 3.
X-ray micrographs of the microvasculature of the leg area of a tumor bearing mouse, taken with the ExiTron® Nano 6000 contrast agent. (a) is an in vivo microradiology image taken 4 min after the agent injection. (b) and (c) are magnified images of the square regions in (a) corresponding to a tumor area (b) and to a normal tissue area (c). Some small vessels of diameter ~23 μm are marked by the arrowheads. (d) and (e) are high resolution X-ray images showing microvessels in subcutaneous tissue and muscle vessels The arrowheads mark examples of the smallest vessels, ~20 μm in (d) and ~8 μm in (e). Scale bars: 1 mm (a), 500 μm (b and c) and 10 μm (d and e)

