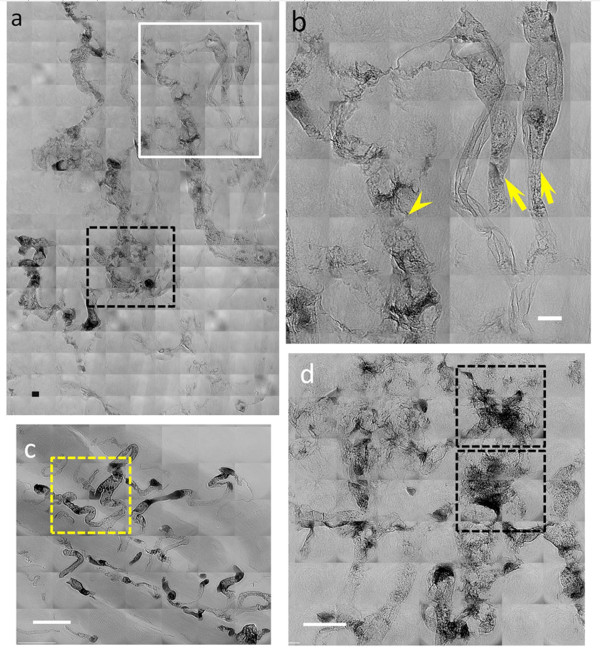
Figure 6.
High resolution X-ray images of a 7 day tumor in a mouse after heparin treatment and bare-AuNP injection. (a), (b) and (d) are images taken from subcutaneous tumor areas whereas (c) refers to a normal tissue region. The two arrows in (b) mark the normal vessels; the arrowhead marks tumor vessels that show extravascular diffusion of the bare-AuNPs. (d) shows abnormal microvasculature, especially in the two marked squares, with bare-AuNPs diffused out of the microvessles. Scale bars: 10 μm (a and b) and 25 μm (c and d)

