
Figure 3.
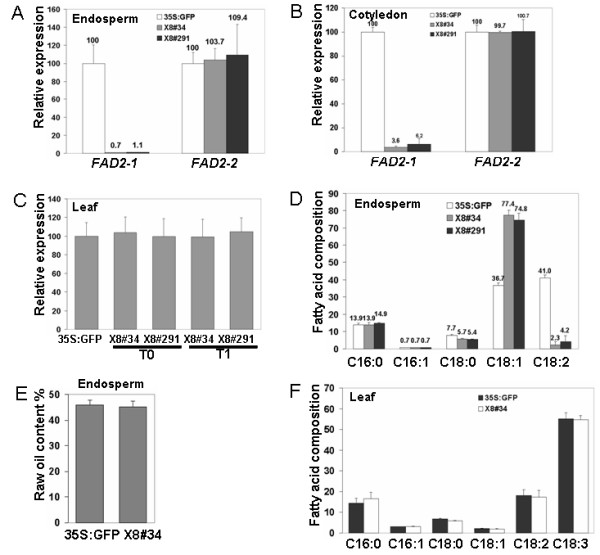
Molecular and oil composition analysis of X8-FAD2-1i lines. (A) Quantitative analysis of FAD2-1 and FAD2-2 expression levels in T1 endosperm of #34, #291 and 35S:GFP (CK-) lines. (B) Quantitative analysis of FAD2-1 and FAD2-2 expression levels in T1 cotyledons of #34, #291 and 35S:GFP (CK-) lines. (C) Quantitative analysis of FAD2-1 expression levels in T0 and T1 true leaves of #34, #291 and 35S:GFP (CK-) lines. (D) GC analysis of fatty acid composition in T1 endosperms of #34, #291 and 35S:GFP (CK-) lines. (E) Oil content analysis in T1 endosperm of #34 and 35S:GFP (CK-) lines. (F) GC analysis of fatty acid composition in T1 true leaves of #34 and 35S:GFP (CK-) lines.