
Figure 4.
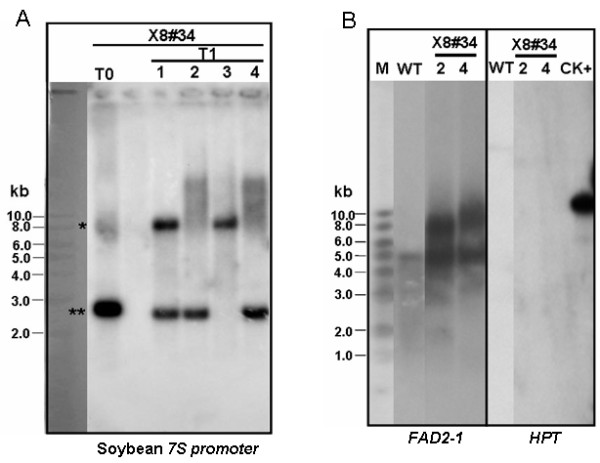
Southern blot analysis of T0 and T1 plants from X8-FAD2-1i #34 line. (A) Total genomic DNA were digested with XhoI and hybridized with soybean 7S promoter probe. *Shows the positive genomic bands containing marker; **shows the positive genomic bands that are marker free. (B) Total genomic DNA were digested with EcoRV and XbaI and hybridized with FAD2-1 probe (left panel). The same membrane was stripped and hybridized with HPT probe (right panel). The signals shared between wild-type and the transgenic lines represent the endogenous JcFAD2-1 sequence. Each of the transgenic lines also shows one extra band corresponding to the transgene insert.