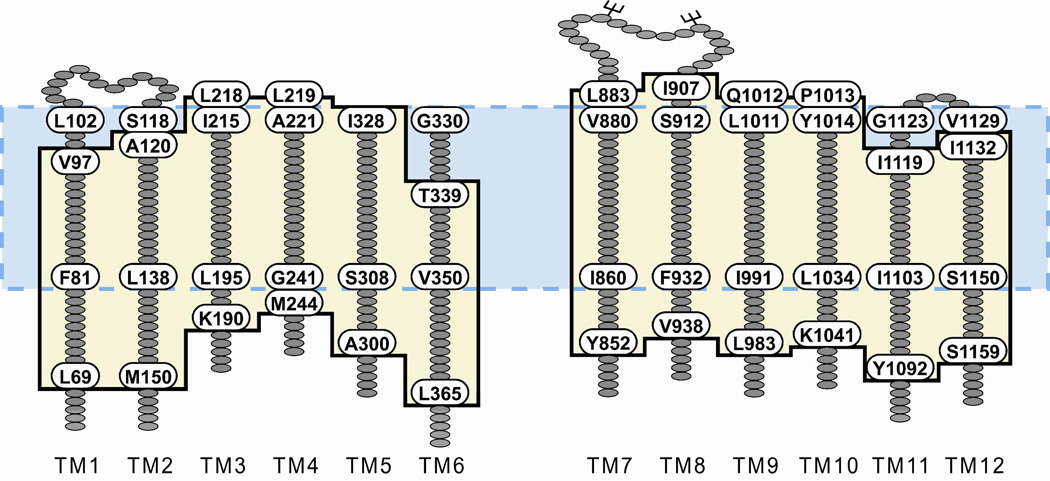
Figure 2. TM segment lengths and boundaries predicted by inserting the model protein into a lipid bilayer differ from those defined by hydropathy analysis.
Hydropathy analysis of CFTR yields TM segments 22 amino acids in length (23), the boundaries of which are illustrated by the blue box with the dashed border. To determine the boundaries of the TMs predicted by the protein-bilayer model, 27 MD frames were visually analyzed to determine the amino acids in each TM that were located within the DMPC bilayer. The average boundaries are illustrated by the tan box with the black border. Labeled amino acids define the TM borders predicted by each method.

