
FIG. 8.
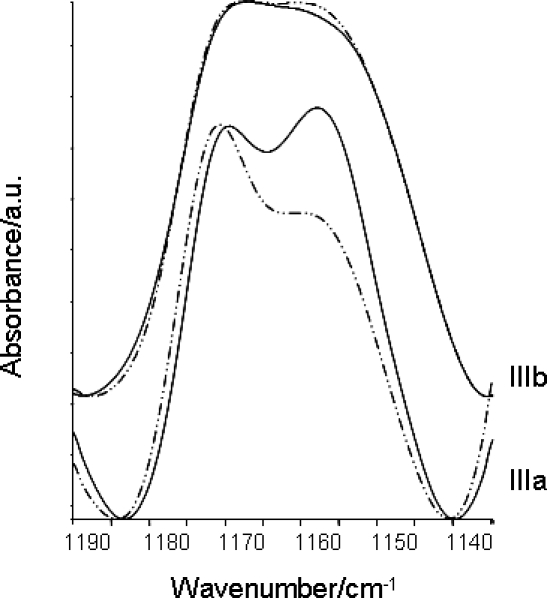
Average spectra of stage IIIa and IIIb follicles (– · · –, control; ——, probiotic treated) in the range of 1190 to 1130 cm−1 (stage IIIb spectra were shifted along the y-axis).
Official websites use .gov
A
.gov website belongs to an official
government organization in the United States.
Secure .gov websites use HTTPS
A lock (
) or https:// means you've safely
connected to the .gov website. Share sensitive
information only on official, secure websites.
Average spectra of stage IIIa and IIIb follicles (– · · –, control; ——, probiotic treated) in the range of 1190 to 1130 cm−1 (stage IIIb spectra were shifted along the y-axis).