FIGURE 4.
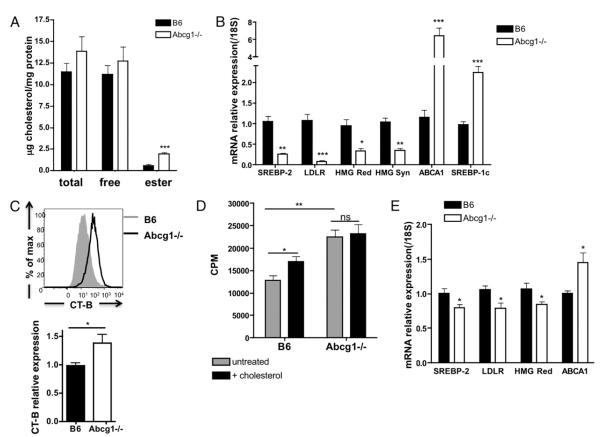
Abcg1−/− CD4 T cells have increased cholesterol content. A, Total cholesterol and free cholesterol was measured in purified CD4 T cells by gas chromatography (n = 7). Cholesteryl ester was calculated as the difference between total and free cholesterol (multiplied by 1.67). B, SREBP-2 and LXR targets genes measured in naive CD4 T cells by real-time PCR (n = 6–10). C, Lipid rafts were measured in CD4 T cells by flow cytometry using fluorescently labeled CT-B (see Materials and Methods). A representative intensity plot of B6 and Abcg1−/− lipid raft staining. Graph represents relative expression to B6 mean fluorescence intensity of CT-B Alexa Fluor 488 (n = 15). D, Naive CD4 T cells were purified from B6 and Abcg1−/− mice (n = 4), incubated with 20 μg/ml soluble cholesterol for 2 h, and stimulated with αCD3αCD28 beads. 3H thymidine was added to cultures after a 48-h stimulation and harvested after 18 h. E, SREBP-2 and LXR target genes measured in thymocytes by real-time PCR (n = 6–10). *p < 0.05; **p < 0.01; ***p < 0.001.

