FIGURE 6.
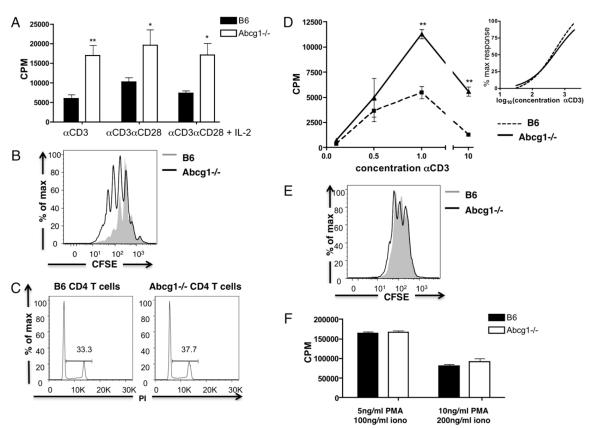
Naive CD4 T cells from Abcg1−/− mice are hyperproliferative to TCR stimulation. Naive CD4 T cells were purified from spleen. A, Cells (n = 4) were stimulated with plate-bound αCD3 (1 μg/ml), soluble αCD28 (1 μg/ml), and IL-2 (10 U/ml). 3H thymidine was added to cultures after a 48-h stimulation and harvested after 18 h. B, CFSE-labeled cells (n = 4) were stimulated with 1 μg/ml plate-bound αCD3 and 1 μg/ml αCD28, and CFSE dilution was measured after 72 h. C, Cells (n = 3) were stimulated with 1 μg/ml plate-bound αCD3 and 1 μg/ml αCD28 and stained with propidium iodide after 48 h to determine the cell cycle. D, Cells (n = 4) were stimulated with 0.1–10 μg/ml plate-bound αCD3 and 1 μg/ml soluble αCD28, and 3H thymidine incorporation was measured. Graph represents 3H thymidine incorporation (inset). Nonlinear curve regression was used to fit the data to sigmoidal curves and calculate EC50. E, CFSE-labeled cells (n = 6) were stimulated with 5 ng/ml PMA and 100 ng/ml ionomycin, and CFSE dilution was measured after 72 h. F, Cells (n = 4) were stimulated with PMA and ionomycin (iono), and 3H thymidine incorporation was measured. *p < 0.05; **p < 0.01; ***p < 0.0001.

