Figure 3.
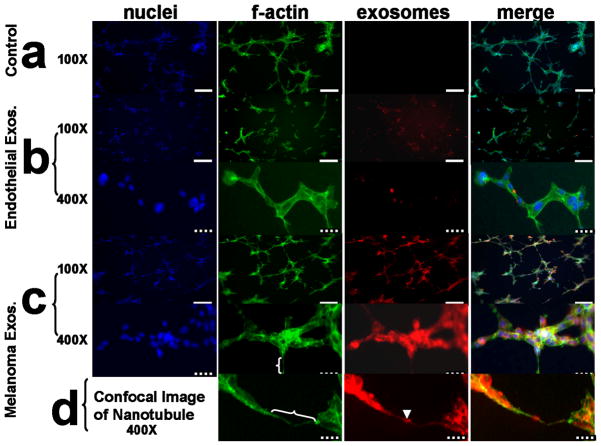
Exosomes interact with and influence the morphology of 3D 2F-2B endothelial cell tubules as evidenced by fluorescent microscopy. (a) 2F-2B endothelial cells (100,000/chamber) cultured on matrigel for 24 hrs in the absence of exogenously labeled exosomes show no red background signal while f-actin is stained green. (b) endothelial cells (100,000/chamber) cultured on matrigel for 24 hrs in the presence of 20 μg/ml of 2F-2B endothelial cell exosomes demonstrate decreased tubule branching versus (a) and show exosome signal in red clusters within green f-actin stained endothelial tubules. (c) endothelial cells (100,000/chamber) cultured on matrigel for 24 hrs in the presence of 20 μg/ml of B16 melanoma exosomes demonstrate increased tubule branching versus (a) and show colocalization between exosome signal in red clusters and green f-actin stained endothelial tubules. (d) Confocal image of red exosome signal co-localized with green stained f-actin in a nanotube bridging two endothelial tubules. white brackets = nanotubes; arrowhead = exosome cluster within a nanotube; solid white bar = 200 μm; hatched bar = 40 μm. Blue fluorescence = DAPI (Vector labs), green = AlexaFluor 488 phalloidin (invitrogen), red = DiI (invitrogen).

