
Fig. 4. The fate of Tbx1-expressing cells during early cardiac development.
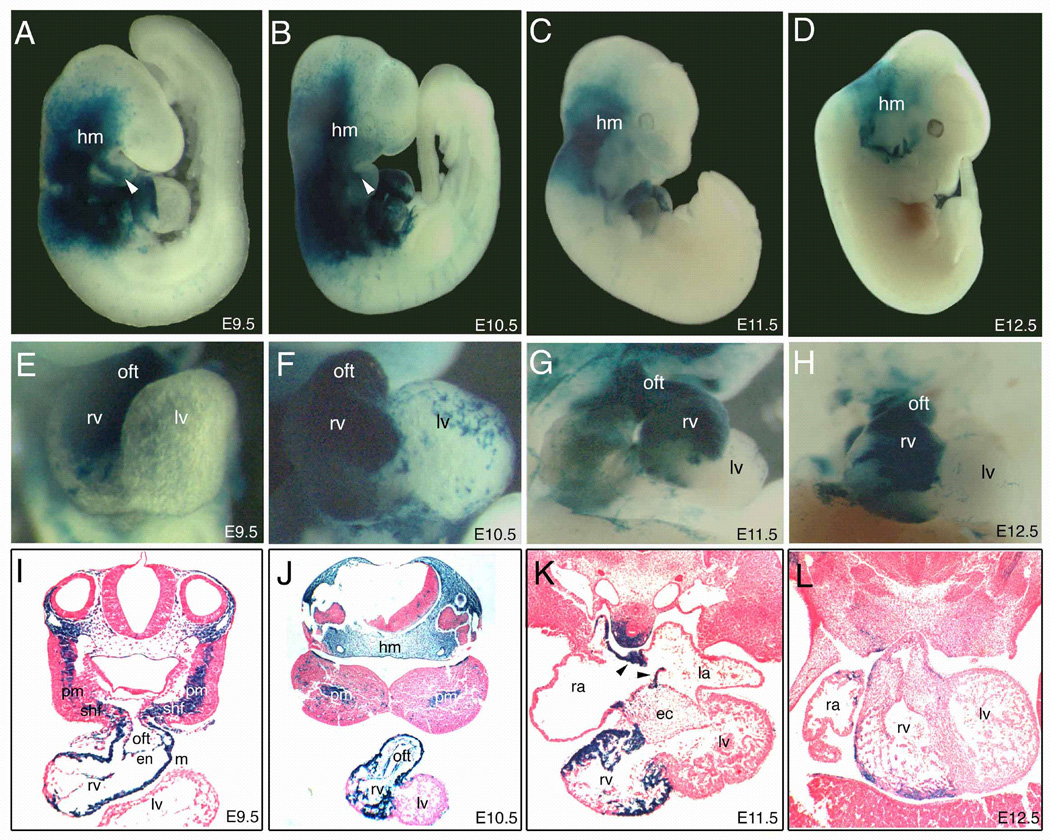
(A–D) Right lateral view of whole-mount lacZ staining of Tbx1-Cre/R26R embryos. The magnified view of each heart (E–H) and transverse sections of each embryo (I–L) are shown. Tbx1-expressing cells were observed at E9.5 (A,E,I), E10.5 (B,F,J), E11.5 (C,G,K), E12.5 (D,H,L). Tbx1-expressing cells were predominantly detectable in the outflow tract (oft) and the right ventricle (rv) at E9.5–10.5 (A, B, E, F, I, J), and relatively restricted in the rv at E11.5–12.5 (C, D, G, H, K, L). Note that blue cells appeared to be continuous from pharyngeal mesoderm (pm) and the secondary heart field (shf) to rv through the oft at E9.5 (I). Tbx1-expressing cells also contributed to the developing atrial septum (arrowheads in K). ec, endocardial cushion; en, endocardium; hm, head mesenchyme; la, left atrium; lv, left ventricle; m, myocardium; ra, right atrium.