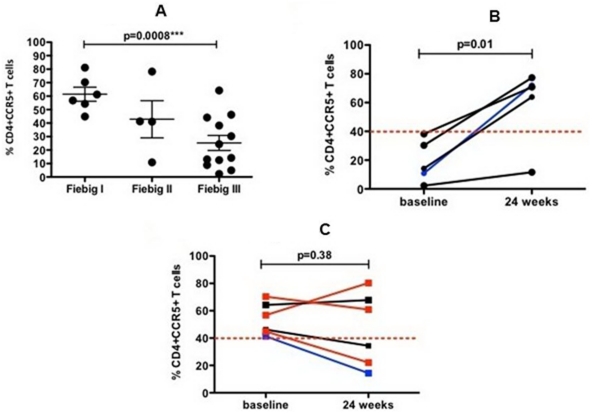
Figure 4. Frequency of CD4+CCR5+ T cells in sigmoid colon in acute-HIV infected subjects.
In the sigmoid colon of acute HIV infection patients, the frequency of CD4+CCR5+ T cells declined significantly from Fiebig I (median: 53%) to Fiebig III (median: 19.3%) (p = 0.0008) ( Figure 4A ). After 24 weeks of megaHAART, the frequency of CD4+CCR5+ T cells was restored in patients with a baseline frequency below the median value of 40% ( Figure 4B ) while patients with a frequency above the median value of 40% at baseline showed a variable response to treatment ( Figure 4C ). For Figure 4A, each dot represents an individual subject with horizontal bars showing median values and interquartile ranges. For Figures 4B and 4C, each line represents changes of gut CD4+CCR5+ T cells from baseline to week 24 in an individual subject. Blue line – Fiebig I; black line – Fiebig II; red line – Fiebig III. Data from two Fiebig IV subjects were not included in the analysis.

