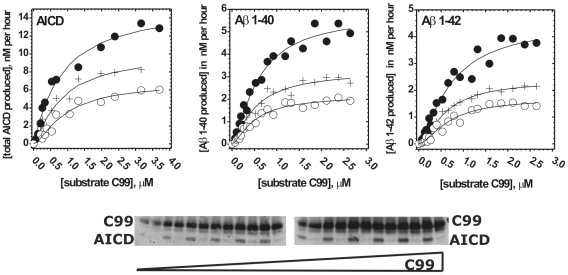
Figure 3. Michaelis-Menten profiles for AICD, Aβ 1–40 and Aβ 1–42 in presence of DAPT.
CHAPSO enriched γ-secretase membranes were used to measure Michaelis-Menten profiles for total AICD production in presence of 0 nM (•), 70 nM (+) and 150 nM (O) of DAPT. Michaelis-Menten profiles for Aβ 1–40 and Aβ 1–42 production were measured in presence of 0 nM (•), 100 nM (+) and 200 nM (O) of DAPT. All profiles have been analyzed using nonlinear regression and the eqn. 4 (methods). The corresponding best fit values are summarized in Table 2. The gel strips show different concentrations of the C99 substrate and the corresponding AICD products. Alternating in-between are the parallel control reactions in which γ-secretase was inhibited by a mix of 10 µM of DAPT and LY-411,575 [3], [4]. AICD was measured using antiflag M2 antibodies (as shown in the gel strip). Aβ 1–40, and Aβ 1–42 were measured using AlphaScreen® as described in methods section.

