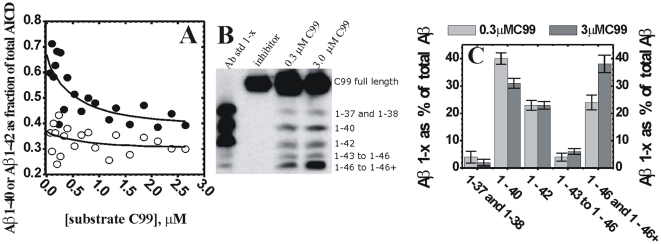
Figure 4. Changes in Aβ products caused by gradual saturation of γ-secretase.
Saturation of γ-secretase with its C99 substrate leads to decrease in Aβ40 production with concomitant increase in production of the longer more hydrophobic Aβ peptides and Aβ42/Aβ40 ratio. (A) The saturation profiles from Fig. 3 were used to calculate the ratio between Aβ 1–40 (•) and Aβ 1–42 (O) production and the total AICD production. The ratio curves were calculated using the saturation profiles from Fig. 3 in the absence of DAPT. ( B ) Urea gels were used to analyze the relative distribution of different Aβ 1-x fragments at half-saturating (0.3 µM) and saturating (3.0 µM) concentrations of C99 substrate. The lane “Aβ std 1-x” represents synthetic peptides as mobility standards, the lane “inhibitor” represents parallel control reaction in the presence of 10 µM of γ-secretase inhibitors DAPT and LY-411,575 [3], [4]. ( C ) The relative intensity of each Aβ 1-x peak is shown as a percent of the total sum of all Aβ peaks in the corresponding lane. The intensity of different Aβ 1-x products was quantified by transforming the individual bands into a series of peaks using the “ribbon option” in program ImmageQuant 5.0. The resulting peaks and the corresponding baselines were quantified using the “peak-fit” option in MicroCal Origin 7.0 program.

