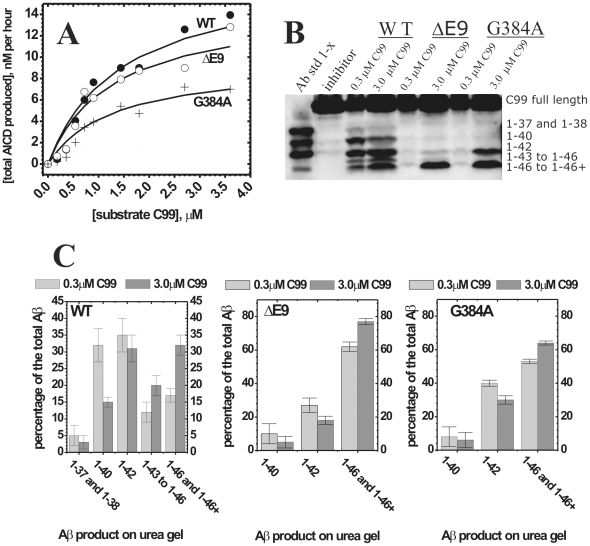
Figure 8. AICD and Aβ production by WT presenilin 1 and two FAD mutants.
CHAPSO enriched γ-secretase membranes carrying WT presenilin 1 or FAD mutants ΔE9 and G384A have been prepared and analyzed in parallel with all conditions identical. ( A ) Michaelis-Menten profiles for total AICD production (i.e. the turnover rates [37]) were measured in parallel using anti-flag αM2 antibodies as shown in Fig 3. ( B ) urea gels show the relative distribution of different Aβ 1-x products at the sub-saturating and saturating substrate concentrations (5 hour reactions). The lane “Aβ std 1-x” represents synthetic peptides as mobility standards, the lane “inhibitor” represents a parallel control reaction in the presence of 10 µM of γ-secretase inhibitors DAPT and LY-411,575 [3], [4] ( C ) The relative intensity of each Aβ 1-x peak is shown as a percent of the total sum of all Aβ peaks in the corresponding lane. The intensity of different Aβ 1-x products was quantified by transforming the individual bands into a series of peaks using the “ribbon option” in program ImmageQuant 5.0. The resulting peaks and the corresponding baselines were quantified using the “peak-fit” option in MicroCal Origin 7.0 program.

