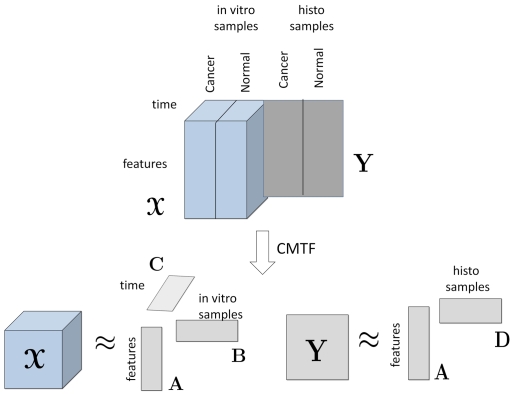
Figure 2. Analysis of histology and in vitro data sets using coupled matrix and tensor factorization (CMTF).
Time mode is slotted as 0, 1, 2, 4, 6, 10, 16, 24, 72, 120, 168 in hours. Features mode contains the cell graph features: average degree, clustering coefficient C, clustering coefficient D, clustering coefficient E, average eccentricity, diameter, radius, average eccentricity 90, diameter 90, radius 90, average path length, effective hop diameter, hop plot exponent, giant connected component ratio, # connected components, average connected component size, % isolated points, % end points, # central points, % central points, mean, std, skewness, kurtosis, # nodes, # edges. These features are defined in Table S1.

