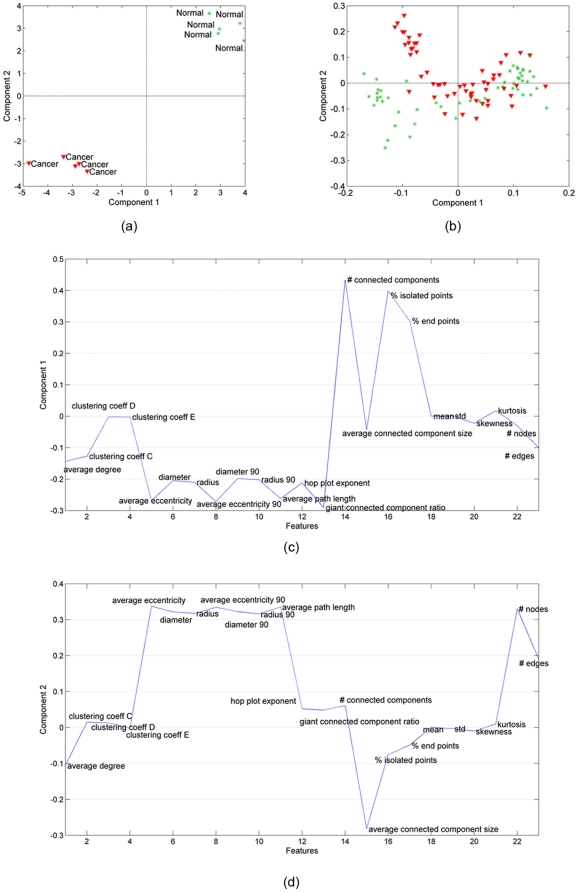
Figure 6. Three-way and two-way analysis of in vitro bone tissue data.
(a) CP factorization of the tensor with modes: features, samples and time. Both the 1st and the 2nd components separate the two different functional states: cancer (red-triangle sign) from normal (green-plus sign) tissue samples; (b) SVD of matrix of type: features by samples (across all times); (c) features projected over the 1st component of CP model. Cell-graph features such as % of end points, number of connected components, giant connected component ratio, average path length, average eccentricity are identified as influential in the analysis since their coefficients diverge the most from zero; (d) since the 2nd component can also distinguish between two functional states we also show the 2nd CP component in features mode. Note that the influential features are different in the 2nd component, e.g., while the number of connected components has a high coefficient in the 1st component, its coefficient in the 2nd component is close to 0.

