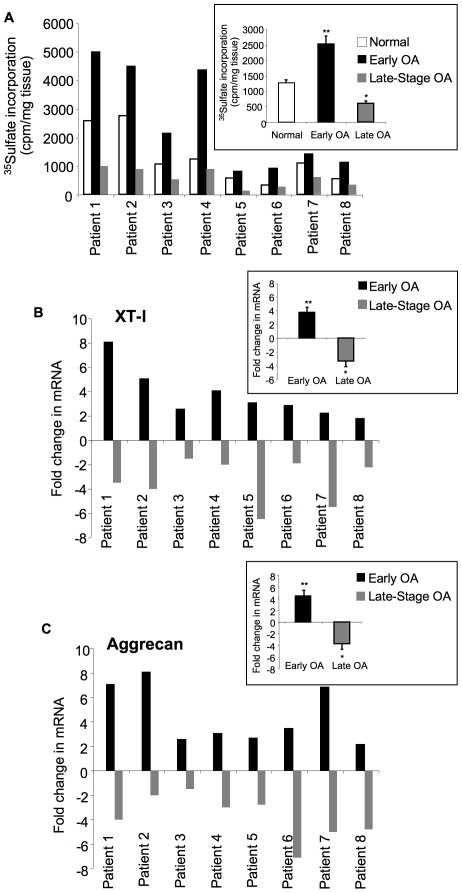
Figure 2. Analysis of GAG synthesis and expression of XT-I and aggrecan genes.
(A) GAG synthesis analysis in cartilage from “normal”, early OA and late-stage OA areas for each patient studied by 35S-sulfate incorporation. Insert shows the mean of GAG synthesis rate values corresponding to different areas of cartilage sample from all patients. Values are mean ± SEM of 3 experiments per parameter, per joint, per patient. (B) and (C) Analyses of the expression of XT-I and aggrecan genes in cartilage from normal, early OA and late-stage OA areas for each patient. The expression level of the genes was analyzed by qPCR. Measurements were normalized to the control “normal”. Inserts in (B) and (C) show the mean of XT-I and aggrecan gene expression level values corresponding to different areas of cartilage sample from all patients. Values are mean ± SD of 3 experiments per parameter, per joint, per patient. **significantly (P<0.01) higher than normal and late groups; §significantly (P<0.05) higher than normal and late groups; *significantly (P<0.05) lower than normal.

