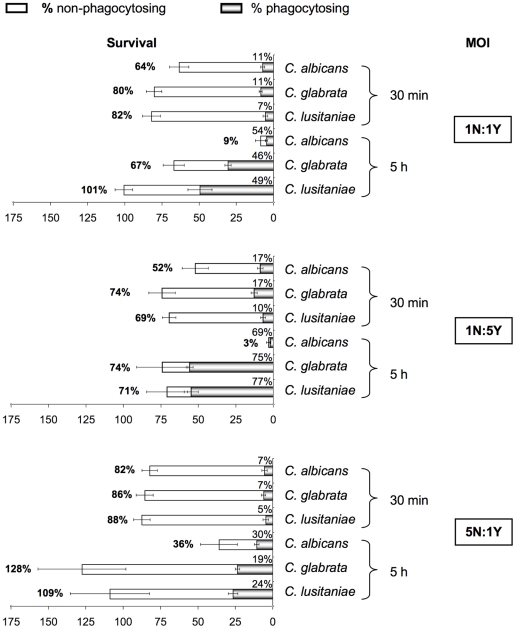
Figure 7. Analysis of human neutrophil interaction with live yeast cells in stationary phase at different MOIs over 5-hour time course experiments.
The diagram shows the flow cytometer analysis of the neutrophils. The horizontal bar represents the neutrophil survival, indicated as a percentage on the left side of the bar. The white part of the bar represents the percentage of non-phagocytosing neutrophils, the shaded tones part represents the percentage of phagocytosing neutrophils. Note that more neutrophils died when infected with C. albicans than with C. glabrata and C. lusitaniae. Each condition was performed in quintuplet per experiment. Each bar is the average of three independent experiments ± standard error.

