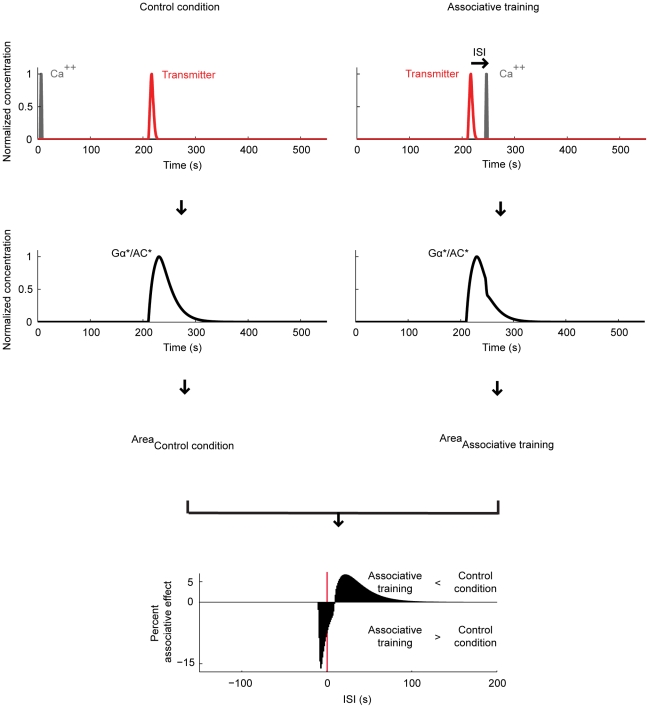
Figure 4. Relative timing of the transmitter and Ca++ affects the adenylate cyclase.
We stimulate the model with transmitter and Ca++ (see Fig. 3B for the details). In the ‘control condition’ (left), Ca++ precedes the transmitter by an onset-to-onset interval of 210 s. In ‘associative training’ (right), the two inputs follow each other with an inter-stimulus interval (ISI), which is varied across experiments. Negative ISIs indicate training with first Ca++ and then the transmitter; positive ISIs mean the opposite sequence of inputs. For either condition, we take the area under the respective Gα*/AC* concentration curve as a measure of cAMP production. For each ISI, we calculate an ‘associative effect’, by subtracting the amount of cAMP produced during the respective associative training from that in the control condition. We then express the associative effect as percent of the area under the Gα*/AC* concentration curve in the control condition. These percent associative effects are plotted against the ISIs. For very large ISIs, we find no associative effect. If the Ca++ is closely paired with the transmitter, we find negative associative effects; the strongest negative associative effect (−15.5%) is obtained when using ISI ∼−3 s. If on the other hand Ca++ follows the offset of the transmitter during training, we find positive associative effects; the largest positive associative effect (6.3%) is obtained for ISI ∼26 s. Thus, depending on the relative timing of Ca++ and transmitter during training, opposing associative effects come about, closely matching the behavioural situation in Fig. 1.

