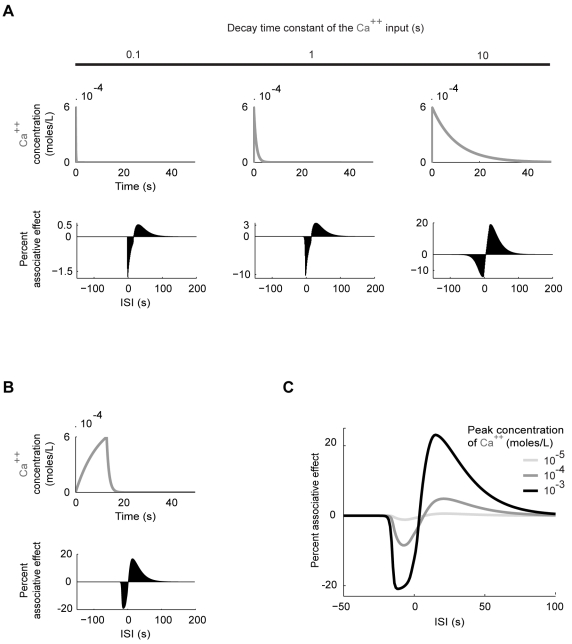
Figure 8. Influence of Ca++ duration and intensity.
Complementing the analysis shown in Fig. 7 we now vary the Ca++ input while keeping the transmitter input fixed. In all three examples shown in (A), the Ca++ input rises to a peak of 6·10−4 moles/L within 40 ms after the Ca++ onset, but decays with different time constants, chosen as 0.1 s, 1 s and 10 s (A, top). In this scenario, the associative effects increase with increasing Ca++ duration (A, bottom). In addition, a large decay constant causes a long tail of the Ca++ input that enables negative associative effects for longer ISIs (A, the last case). In (B) we provide an exemplary Ca++ input (B, top) which gives good fit to the behavioural results in Fig. 1 in terms of the ISI-dependency of the associative effects but not in terms of their sizes relative to each other (B, bottom). In this case, the Ca++ concentration rises to a peak of 6·10−4 moles/L within 13 s after the onset, comparing well with the 15s- long odour presentation in Fig. 1. Note that the best negative associative effect occurs with ISI = −13 s, similar to the behavioural situation in Fig. 1. Finally, in (C), we study the effects of the intensity of the Ca++ input. We fix the transmitter input and use the Ca++ input depicted in (B), but scaled up and down by one order of magnitude. The intensity of Ca++ strongly influences the sizes of both the negative and the positive associative effects; the balance between the two is however somewhat compromised with increasing Ca++ intensity.

