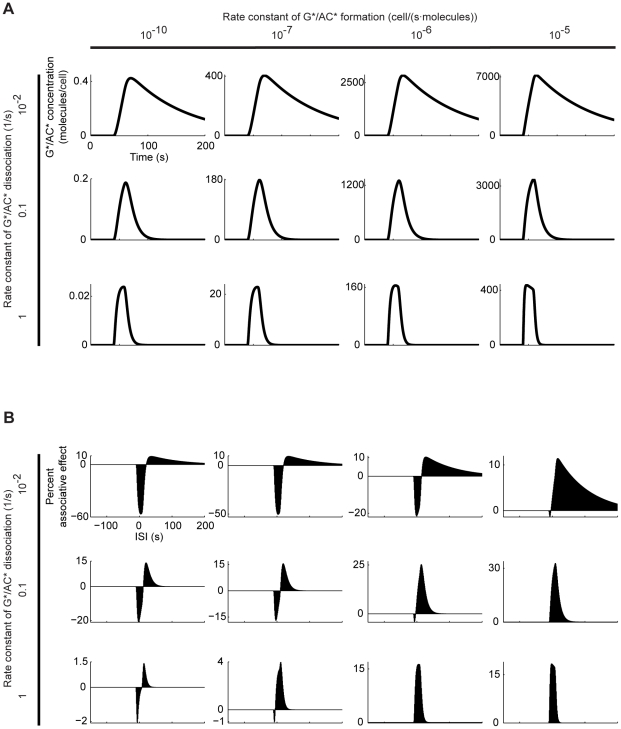
Figure 10. Alternative model: Influence of G*/AC* formation and dissociation rate constants.
A. We stimulate the alternative model based on [45] with a transmitter input (details as in Fig. 3B) and plot the time course of the resulting G*/AC* concentration. B. Repeating the experiment in Fig. 4, we plot the percent associative effect as a function of the ISI. Comparison with Fig. 5 shows that despite their various differences both models generate rather similar associative effects.

