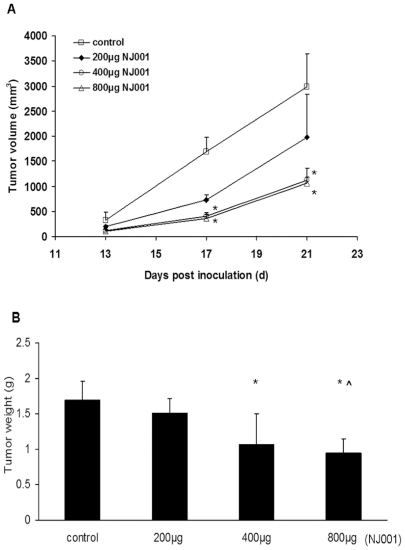
Figure 6. Inhibition of tumor growth in vivo by NJ001 in the SPC-A1 xenograft model.
(A) Tumor growth curve. Animals were subcutaneously injected with 2×10⁶ SPC-A1 cells and intraperitoneally injected with normal saline, 200 µg, 400 µg, or 800 µg NJ001. Tumor volumes were measured at 4-day intervals. The error bars represent standard deviation. (B) Average tumor weight in the antibody and control groups. After 3 weeks of treatment, tumors were excised and weighed. The error bars represent standard deviation. * P<0.05 compared to the control group. ∧ P<0.05 compared to the 200 µg NJ001 group.

