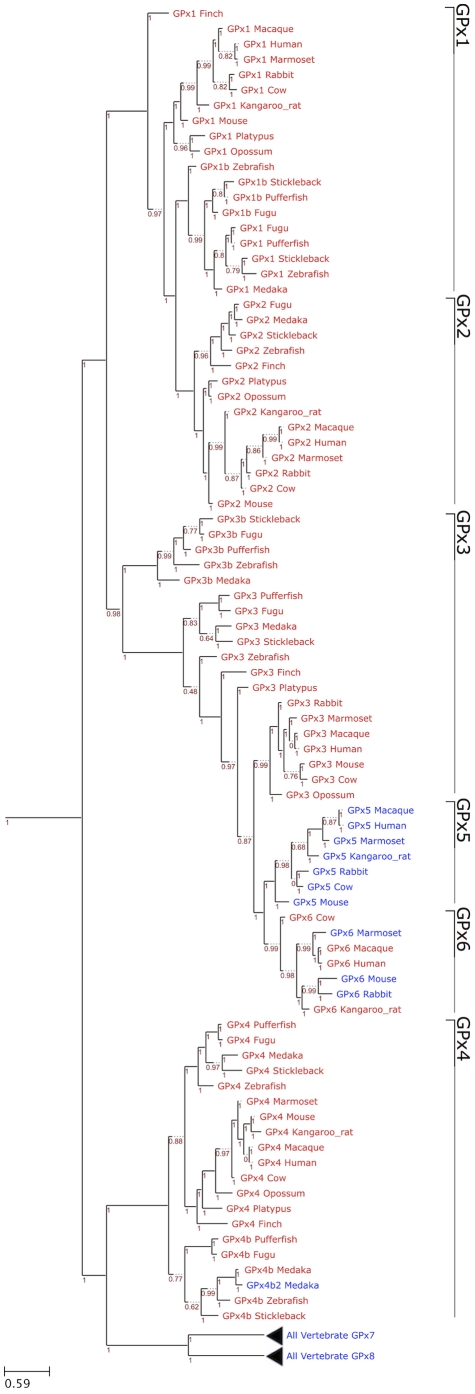
Figure 4. Phylogenetic tree of GPx family in eukaryotes.
The figure shows a ML tree computed using the JTT substitution model. In the phylogram, Sec-containing proteins are shown in red and Cys-containing homologs are shown in blue. The GPx families are indicated on the right. The distance scale in substitutions per position is indicated at the bottom left. The branch support is shown in red.

