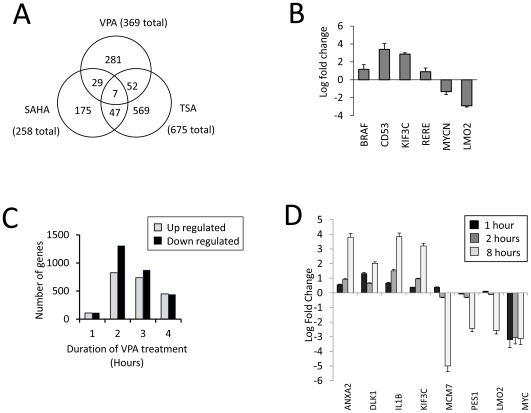
Figure 2. Changes in transcript level induced by HDACi.
(A) Venn diagram showing genes where transcript levels changed significantly (p<0.01) in response to HDACi, detected by HGMP 5K array (5000 gene probes). HL60 cells were treated with VPA (5 mM), SAHA (2.5 µM) or TSA (165 nM) for eight hours. (B) RT-qPCR was used to quantify the transcriptional change at genes that responded to all three HDACi. HL60 cells were treated with VPA (5 mM, 8 hours). Transcript abundance was normalised to β-actin, and presented on a base 2 logarithmic scale. Values are presented with a standard error of mean (n = 3). (C) Cells were treated with VPA (5 mM), and transcript abundance analysed at defined time points using Operon microarrays (25823 genes). Quantitative presentation of the number of genes that were more than 2-fold up-regulated (Shaded bars) or down-regulated (Filled bars) at time points during the time course. (D) RT-qPCR was used to quantify the transcriptional change at genes that responded to VPA (5 mM) at 1, 2 and 8 hours treatment. Genes show divergent responses, including early and continued up-regulation (ANXA2, DLK1, IL1B, KIF3C), little initial change and subsequent down-regulation (MCM7, PES1, LMO2) or early and persistent down-regulation (MYC). Transcript abundance was normalised to β-actin, and presented on a base 2 logarithmic scale.

