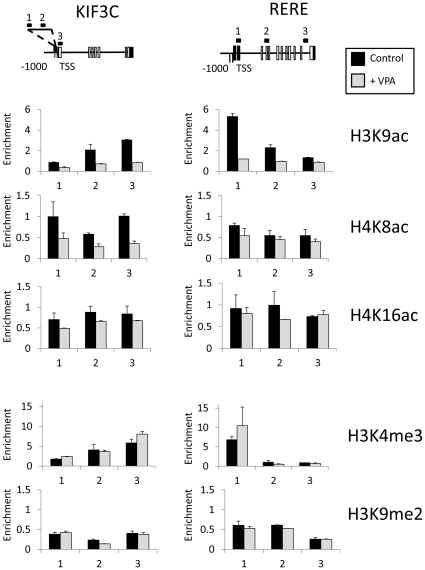
Figure 3. Histone modification distribution on genes up-regulated by VPA.
Chromatin immunoprecipitation analysis of histone modifications on two VPA-responsive genes: KIF3C and RERE. Graphs indicate the enrichment of histone modifications at specific primer pairs in untreated cells (Control), and after eight hours of VPA treatment (+VPA). Histone modification enrichment is shown as a bound∶unbound ratio. The primers used are indicated on gene diagrams, which also indicate the transcription start site (TSS), exons (Empty boxes), and untranslated regions (Filled boxes). The abundance of a histone modification (‘Enrichment’) is calculated from the ratio of material detected in bound∶unbound fractions.

