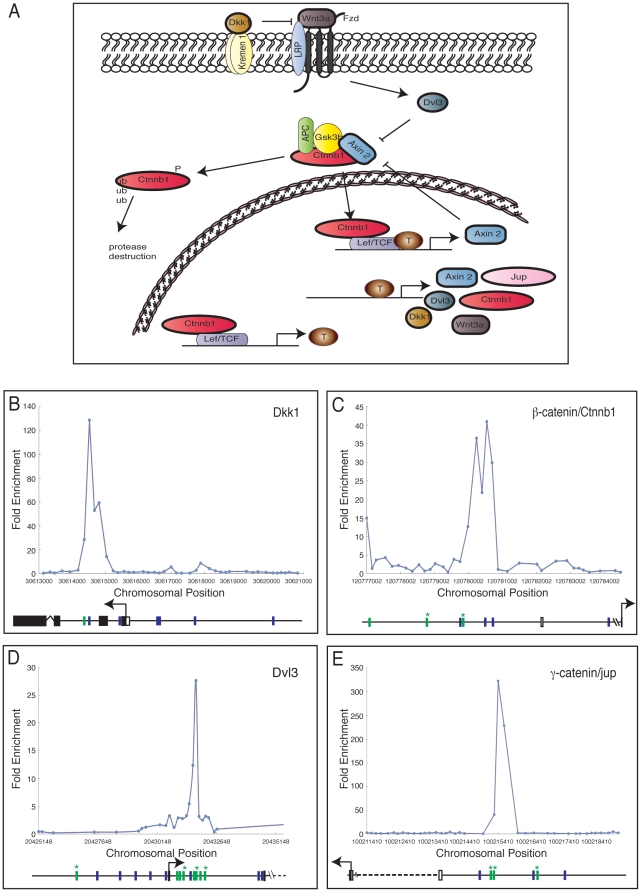
Figure 3. Components of the Wnt pathway as Brachyury targets.
(A) The Wnt signalling pathway. Arrows indicate positive interactions and bars represent negative interactions. Targets identified in this study are outlined in bold. (B–E) Brachyury binding in genomic regions around Dkk1 (B); Ctnnb1/β-catenin (C); Dvl3 (D); and γ-Catenin/jup/plakoglobin (E). Each target shows fold enrichment against chromosomal position. Blue bars represent the T box-like site TSACANNT (N = any base, S = G/C) and green bars represent (AC)n. Stars above bars represent sequence on the reverse strand. Plots are average of triplicate chip results, aligned to the mm8 Feb. 2006 assembly.

