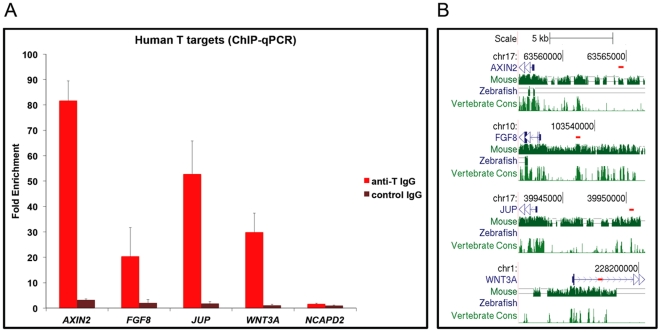
Figure 7. Conservation of BRACHYURY binding in the human genome.
(A) ChIP-qPCR performed on samples from differentiated hECSs using a specific anti-BRACHYURY IgG and a non-specific control IgG. Graph shows enrichment for regulatory regions of Brachyury targets (AXIN2, FGF8, JUP, WNT3A) and a negative control region (NCAPD2). Results are expressed relative to input chromatin divided by the enrichment for the non-specific control antibody. (B) BRACHYURY binding in the human genome. The short red lines below the chromosomal coordinates (hg19) depict the position of the PCR amplicons relative to the beginning of the human genes (blue). The three bottom tracks show the genome sequence conservation between human and mouse, zebrafish and vertebrate genomes (Genome Browser, http://genome.ucsc.edu/).

