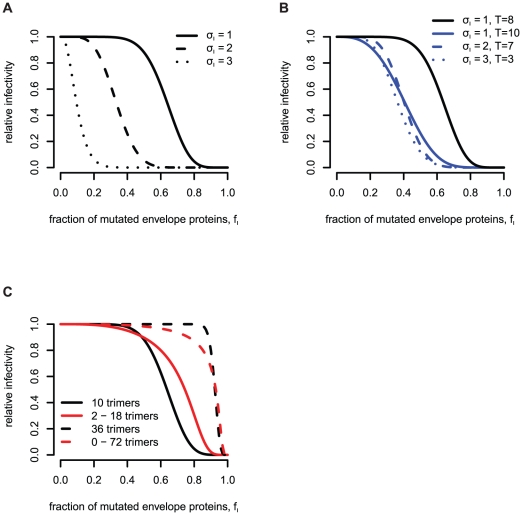
Figure 4. Predictions for the relative infectivity for different subunit stoichiometries in the basic model (equation 4).
For plot (A) and (B) we assume that virions have exactly 10 trimers. For plot (A) and (C) we fix the stoichiometry of entry at  , according to our estimate in [15]. (A) Influence of the subunit stoichiometry
  on the predictions for the relative infectivity. (B) Higher stoichiometries of entry shift the RI curve to the left (solid curves). Together with the effect of the subunit stoichiometry one can find parameter combinations of
  and
and  that lead to similar predictions (blue curves). (C) Dependence of the relative infectivity on the trimer number distribution.

