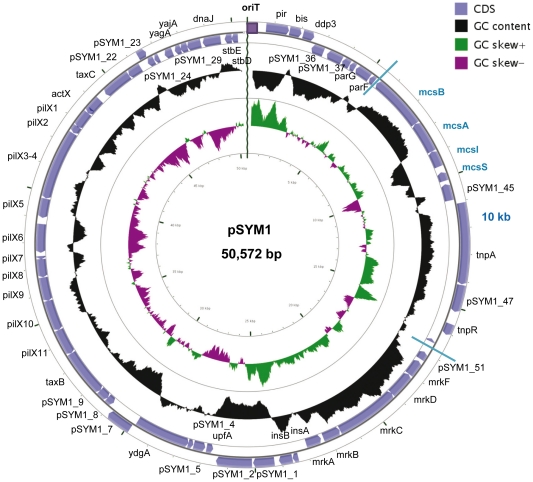
Figure 2. Circular diagram of megaplasmid pSYM1.
The outer circle indicates (to scale) the genetic organization of ORFs within the plasmid. The direction of transcription of each ORF is indicated. The middle circle indicates the GC content, and the inner circle indicates the GC skew. The 10 kb region of pSYM1 that is different from pMAS2027 is marked. The image was constructed using cgview [41]. CDS = coding sequences.

