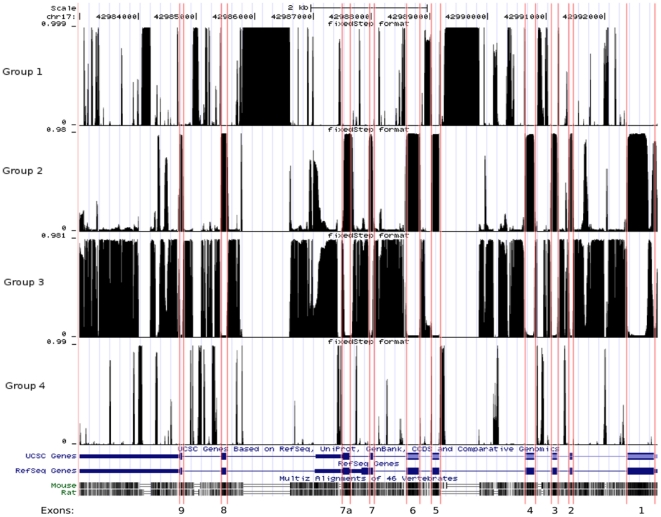
Figure 2. The four segment classes identified in the GFAP gene using changept.
The top four profiles show, for each sequence position in the human GFAP DNA sequence (chr17: 42982993–42992914 in UCSC genomic coordinates), the probability that the base at that position belongs to conservation groups 1 to 4 respectively, as identified by the program changept applied to a 3-way alignment of rat, mouse and human sequences. At any position, the sum of the four profiles is 1. The two rows below the Group 4 profile display the exons (wide bars), the UTRs (narrow bars) and the introns (thin lines) of GFAP genes recorded in the UCSC and RefSeq collections respectively. Below these are the UCSC conservation tracks relative to mouse and rat, in which darker regions correspond to higher conservation, and parallel lines indicate deletions. At the bottom of the figure are the exon numbers. Note that the gene is transcribed from right to left. Exon boundaries are indicated with red vertical lines. Group 1 identifies regions of insertions specific to the human version of the gene; group 2 corresponds mainly to the mapped exons of the GFAP gene, appearing to cover regions of high conservation between the three species; group 3 is comprised of segments in which deletions occur in either the rat or the mouse genes, but not both; group 4 represents the least conserved parts of the gene.

