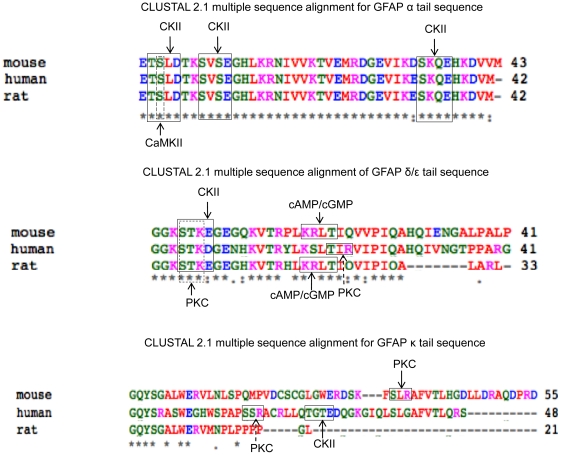
Figure 4. Comparison of human, rat and mouse sequences for GFAPα, GFAPδ/ε and GFAPκ.
Sequences for GFAPα, GFAPδ and GFAPε for the three species and GFAPκ for human and rat were obtained from the NCBI database. Mouse GFAPκ was reconstructed from the genomic sequence and cross-referenced with the sequence reported in Bleichenberg et al (2007). Clustal W results from TCoffee server and predicted phosphorylation sites from PROSCAN are shown. Predicted recognition sites are highlighted by rectangles and predicted phosphorylation sites by an arrow. The phosphorylation site by CaMKII in GFAPα (as annotated in NCIB and HPRD) is also shown. Amino acids (aa) are represented as follows: RED = small aa (small+hydrophobic (incl.aromatic -Y)); BLUE = acidic; MAGENTA = basic; GREEN = hydroxyl+sulfhydryl+amine+G; Grey = unusual amino/imino acids.

