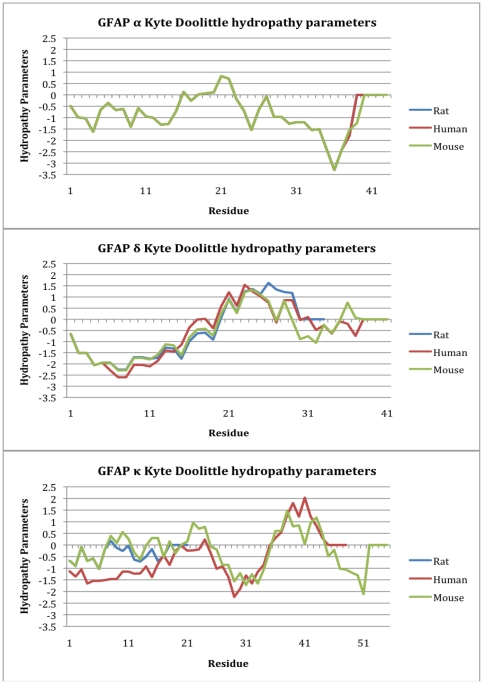
Figure 6. Kyte-Doolittle hydropathy plots for the tail regions of GFAP isoforms across the human, rat and mouse.
The human, rat and mouse sequences are indicated by red, blue and green trendlines respectively. The peaks below zero represent hydrophilicity, whereas those above zero represent hydrophobicity.

