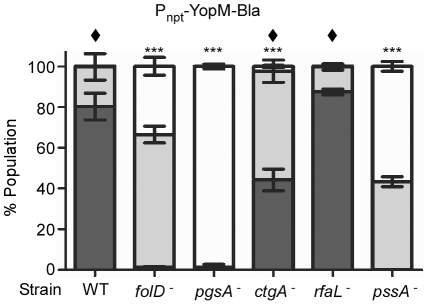
Figure 6. Translocation phenotypes of strains carrying a heterologously expressed Yop reporter.
CHO cells were infected with Y. pestis strains carrying pAH83 at 37°C for 3 hours, followed by CCF2-AM staining and flow cytometry. Cells were analyzed for blue and green fluorescence. The level of translocated Bla reporter is indicated by white (none), gray (intermediate level), or black (high level) bars. For each experiment, the assays were performed in triplicate, and error bars indicate the standard deviation. The data shown is representative of three independent experiments. One-way ANOVA with Tukey post-hoc test was done to demonstrate significant differences in injection (high-level injection, black bars) for mutants relative to the wild type parent. *** P<0.001. Diamonds indicate statistically significant differences (P<0.001) compared to samples in Figure 4, Panel A.

