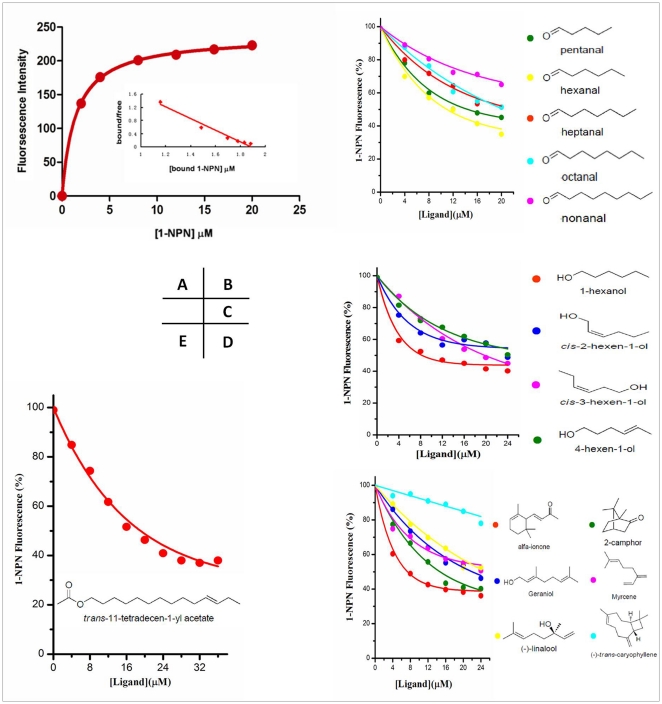
Figure 4. Ligand-binding experiments.
(A) Binding curve and relative Scatchard plot. (B) Competitive binding curves of different-carbon-aldehyde ligands to the LstiGOBP2. The chemical structures of the ligands are shown on the right. Mixtures of proteins and 1-NPN, at a 2 µM concentration, were titrated with a 1 mM ligand solution in methanol. (C, D) Competitive binding curves of different structural arrangement ligands to the LstiGOBP2. (E) Competitive binding curves of the sex pheromone component to the LstiGOBP2.

